



Climate Risks Grow Along with Investments in Climate-related Disasters
Catastrophe Bonds are Quietly Supporting the U.S. Insurance Market
Kalshi CEO Tarek Mansour’s plan to financialize opinions and events in a crowdsourced, “what-if?” approach represents to date the purest example of democratized capitalism: users of the platform will be able to bet on nearly anything, be they the results of an event, the consequences of an action, the likelihood of an occurrence.
Or on something TradersQue has yet to fathom.
If Kalshi‑style betting had existed a year ago, the U.S. decision to pull out of COP30 earlier this fall might have generated big profits for speculators. (Even President Trump’s atypical silence in declining his invitation could have been wagered.)
A more predictable yet peculiar wager could be not on politics, sports, or markets, but rather on the occurrence of hurricanes, wildfires, or floods.
On climate disasters, in other words.
Note: “Climate” throughout this article refers strictly to meteorology and weather, not ideology or politics.
Weathering Risk by Financializing Climate
New betting platforms are not required to see this trend. For decades already, financial markets have financialized climate risk through instruments like catastrophe bonds (“cat bonds”) and other resilience-based tools. These bonds help private insurers manage losses from climate disasters: 1992’s Hurricane Andrew, whose then-record $15 billion in insured losses (about $27.3 billion total), influenced the present-day’s private insurance coverage problems and opportunities.
As climate disasters mount, insurers will rely more heavily on new and arguably unorthodox investment channels rather than raising premiums and pricing out larger client cohorts. Cat bonds represent a prime opportunity as U.S. climate-related funding looks to shift domestically, driven by several factors.
Private Insurers Shift More Risk to Government
The increased frequency and expense of climate-related disasters have spurred many private insurers to abandon high‑risk areas (coastal or drought regions). That leaves governments and public insurers to shoulder the burden as coverage gaps widen and persist.
The U.S. endured 28 disasters in 2023 causing damages of $92.9B. In 2024, 27 disasters cost an unprecedented $182.7B. Events considered “rare” or “anomalies” have been underwritten now as sufficiently frequent and severe to force states and federal agencies to budget continuously (and at times undignifiedly) for recovery, mitigation, and adaptation.
And agencies such as FEMA, HUD, and the U.S. Army Corps of Engineers are under mounting pressure to upgrade infrastructure, support resilient rebuilding, and handle repeated disaster relief claims.
The Seasonal Blueprint of Exposure
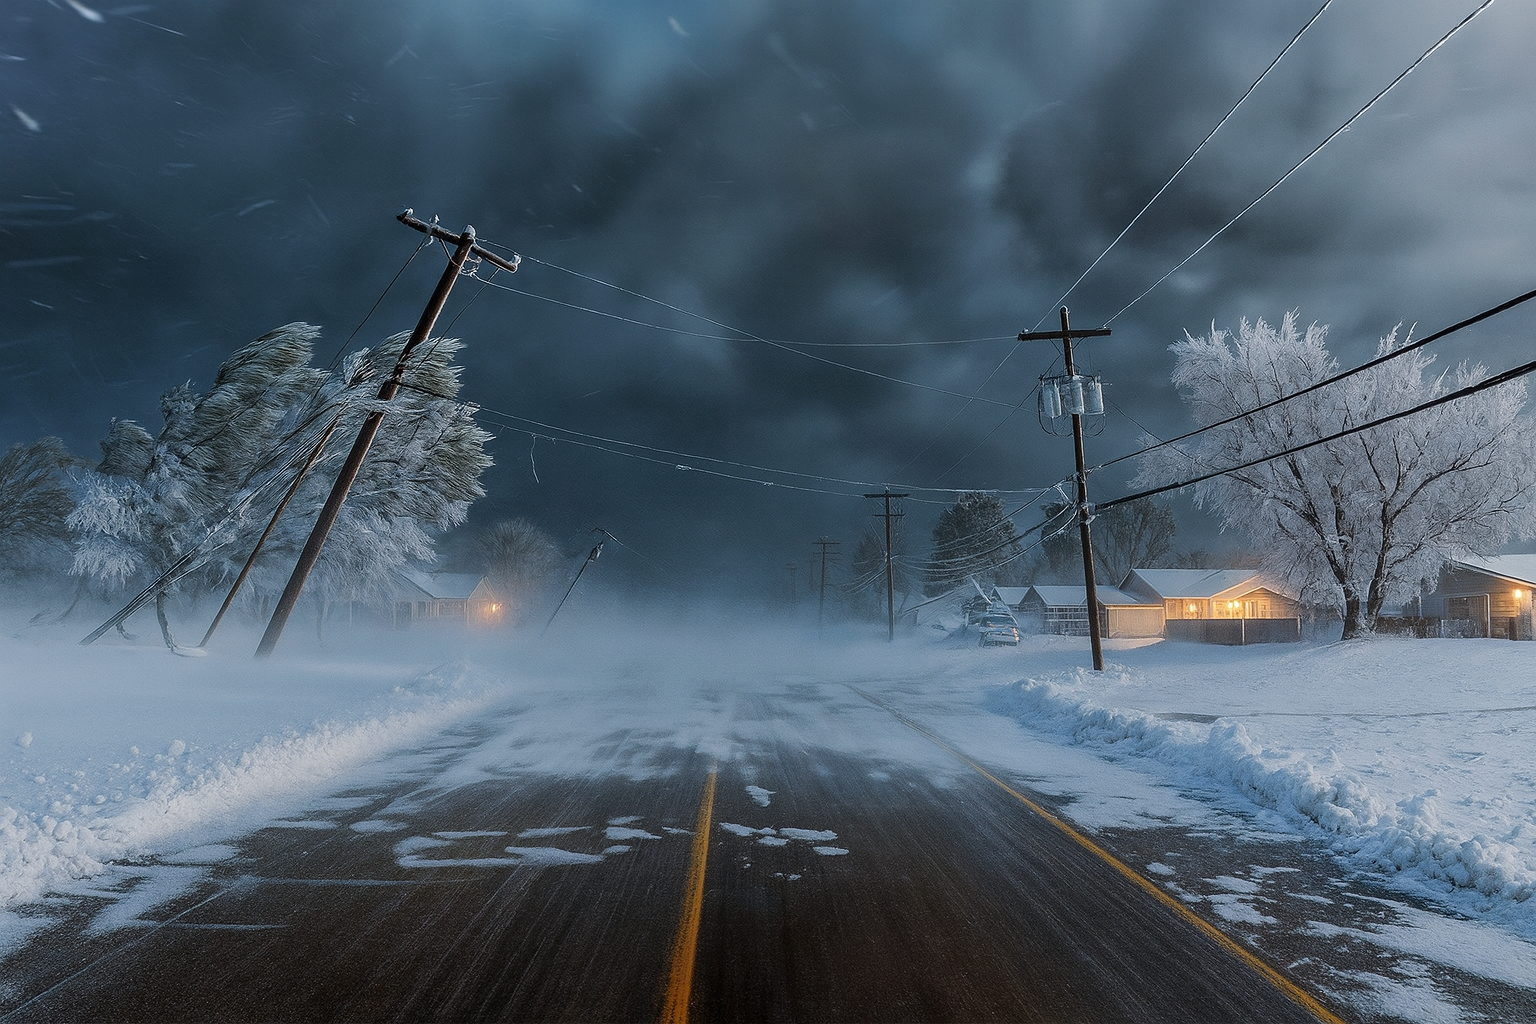
Because of these pressures, the U.S. seeks to redirect spared funds from global climate aid like COP30 toward domestic adaptation and disaster readiness during predictable but crucial seasonal timeframes. These windows often shape pricing cycles, underwriting decisions, and capital deployment with Florida, Texas, and California as media darlings.
| Catastrophe | Peak Months | Insurance Significance |
|---|---|---|
| Hurricanes | Aug – Oct | Hurricanes drive the largest insurance payouts due to the widespread and thus costly nature of wind and storm-surge damage. |
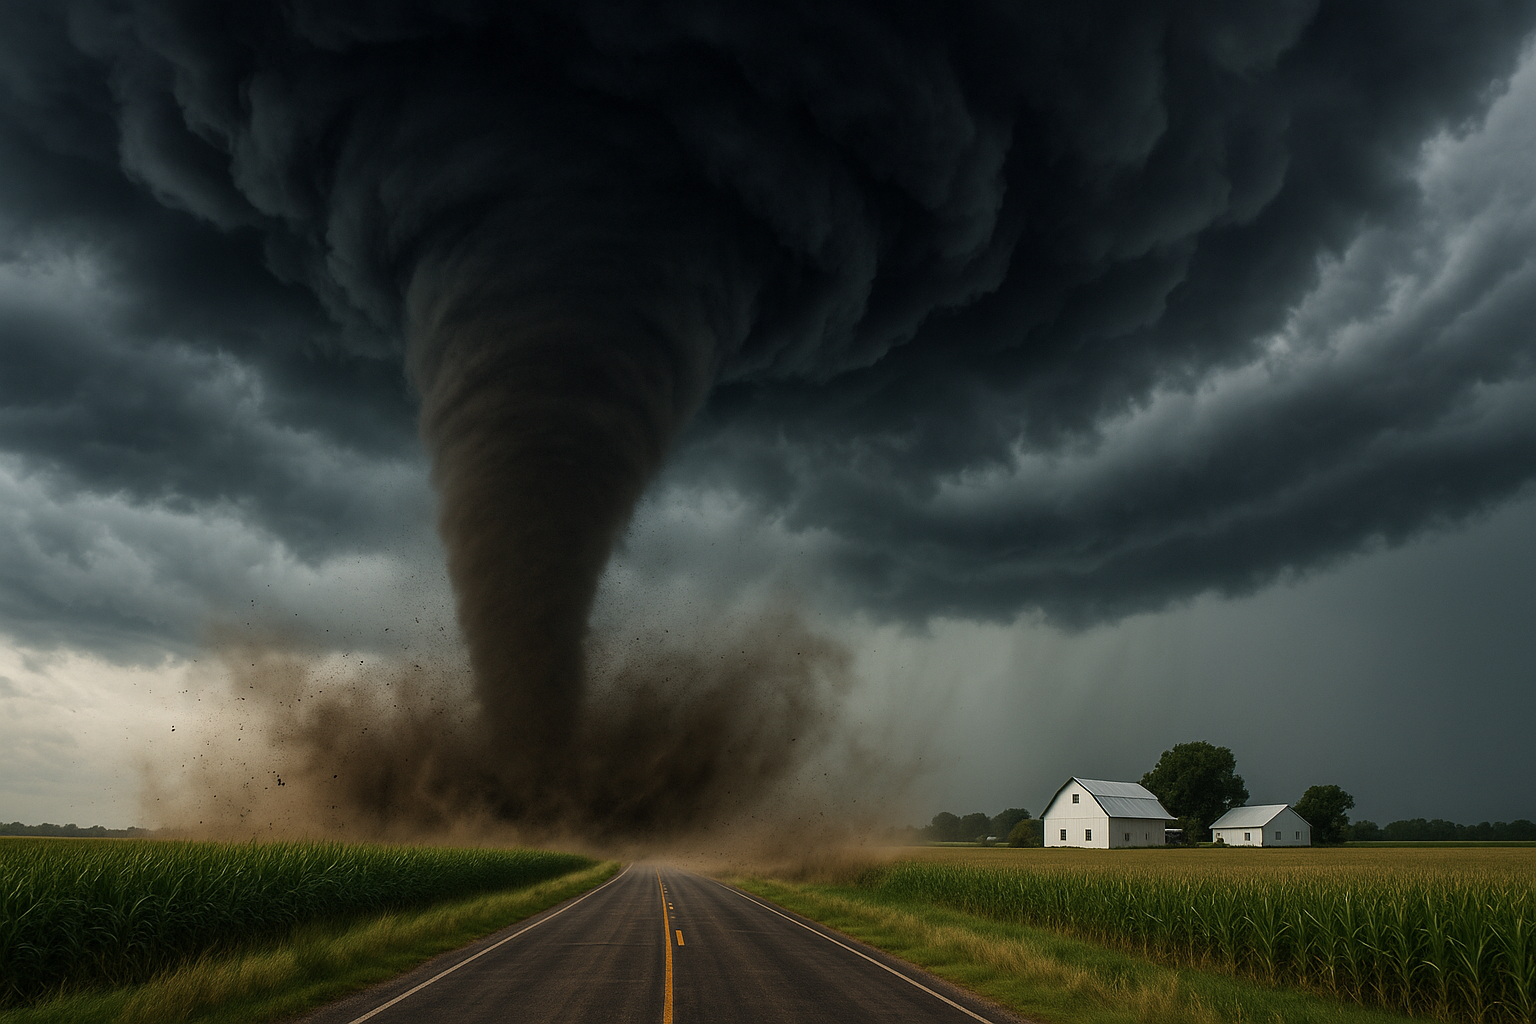
| Severe Convective Storms (Tornadoes) | Mar – Jun | Claims spike because tornadoes and large hail hit many communities repeatedly, leading to frequent homeowner and auto claims. |
| Wildfires | Aug – Nov | Losses escalate quickly when fires spread into populated areas, destroying homes and businesses across large regions. |
| Winter Storms | Dec – Feb | Insurance claims often tied to burst pipes, roof damage, and dangerous travel conditions rise from snow, ice, and freezing temperatures. |
| Inland Flooding | Mar – Jun | Most homeowners lack or cannot access flood insurance, so federal programs, not private insurers, usually cover the bulk of the losses. |
Domestic Adaptation: Captaining U.S. Climate Spending
Over the next decade, regions across the U.S. are expected to face higher risks of mass-scale climate hazards, from Gulf Coast hurricanes to Great Plains heatwaves to coastal flooding. Because disasters now hit more U.S. communities directly and often generate more death, property loss, and population displacement, public support for sending money abroad has dropped. Politicians face increasing pressure to prioritize helping Americans rather than funding global initiatives related to other nations’ climate responsibilities or agendas.
Even before COP30, the U.S. had already committed $11.4 billion by 2024. Yet vulnerable nations’ recent push for a steep rise in international adaptation funding — from roughly $26 billion annually to as much as $310–365 billion annually by 2035 — preempted the absence of the U.S. federal government, historically a major carbon emitter and expected contributor. (A contingent led by California Governor Grant Newsome did represent the U.S. in attendance.)
Climate’s Costly Chaos
While aggregate numbers reveal the funding gap, region-specific hazards like hurricanes, floods, and droughts present immediate threats and concentrated costs. These hazards imperil both federal disaster programs (e.g., FEMA/NFIP) and regional infrastructure often concentrated in high-exposure areas with minimal or inefficient response and recovery measures.
| Hazard | Avg Annual Loss | FEMA/NFIP Risk | High-risk States | At-risk Infrastructure |
|---|---|---|---|---|
| Hurricanes | $40 billion | $15 billion | FL, LA, TX, MS | $850 billion |
| Drought | $9 billion | $4 billion | CA, AZ, NV, NM | $380 billion |
| River Flooding | $7 billion | $6 billion | MO, IL, AR, MS | $310 billion |
| Heatwaves | $6 billion | $2 billion | OK, KS, NE, SD | $220 billion |
| Flash Flooding | $11 billion | $8 billion | NY, NJ, PA, DC | $540 billion |
| Cold Snaps | $3 billion | $1 billion | CO, WY, MT, UT | $150 billion |
| Sea-Level Rise | $14 billion | $12 billion | FL, NJ, LA | $610 billion |
Note: Wildfires have been excluded by request due to attribution complexity (e.g., arson, utility-triggered events, and non-natural ignition sources), which complicates modeling within a strictly natural hazard framework.
Domestic Spending Imperatives
As climate-related disasters intensify, so widens this funding gap between adaptation needs and actual investments, with coastal states facing the severest crisis. A forward-looking scenario analysis—excluding wildfires due to attribution complexities—estimates that the nation will require $795 billion in total adaptation spending through 2027, or roughly $198.75 billion annually.
Current federal allocations, however, remain below $25 billion per year. This funding gap reveals a broader, misdirected preference in U.S. policy and investment: respond to disasters after they happen rather than proactively building resilience and preventing damage.
| Adaptation Category | Total Need | Annualized Need |
|---|---|---|
| Coastal Flood Protection | $280 billion | $70 billion |
| Urban Cooling & Extreme Heat | $130 billion | $32.5 billion |
| Flood Management (River + Storm) | $190 billion | $47.5 billion |
| Drought Resilience | $85 billion | $21.25 billion |
| Hurricane & Storm Fortification | $110 billion | $27.5 billion |
| Total | $795 billion | $198.75 billion |
Even under an accelerated 20% annual growth scenario, funds are likely to cover only $312 billion by 2030, or just 38% of the minimum required by 2030. This persistent gap between preparation and response reflects chronic underinvestment and a status quo preference for recovery over resilience.
And without legislative reform and dedicated financing mechanisms, the trajectory is unlikely to shift in any meaningful way.
Investing in Resilience Through Cat Bonds
By mobilizing global investor capital, catastrophe bonds and similar instruments provide insurers with an additional hedge, reducing the pressure to raise premiums or exit high-risk markets after major disasters or in disaster-stricken regions.
ILS Stock Price | Brookmont Catastrophic Bond ETF | Investing.com
Whether exchange‑listed, institutional, or private—each instrument adheres to the same directives: Investors’ principal buy-in is held in trust and, with accrued interest, is paid out as long as no qualifying disaster occurs after a predefined time.
If a defined catastrophe strikes and crosses certain thresholds or triggers certain metrics, then investors’ principal is used partially or entirely to pay claims. Investors risk partial or total loss, but accept this in exchange for non-correlated, above-market returns.
Put simply,
- Capital is fully collateralized at inception, ensuring that disaster payouts do not depend on insurer solvency.
- Triggers are predetermined and rules‑based, producing transparent and rapid capital access.
- Risk is transferred from insurers to investors, reducing premium pressure and stabilizing insurance markets in high‑hazard regions.
| Instrument | Description |
|---|---|
| Brookmont Catastrophic Bond ETF (NYSE: ILS) | U.S.-listed ETF offering diversified, fully collateralized exposure to catastrophe bonds. Provides daily liquidity for retail and institutional investors. Focused on risk-transfer for extreme events; high-risk, yield-oriented. |
| Securis Catastrophe Bond Fund (UCITS) | European-domiciled institutional UCITS fund pooling global catastrophe-bond exposure. Provides multi-year, model-driven access to fully collateralized insurance-linked securities for licensed and institutional-grade investors. |
| Collateralized Reinsurance Notes | Private or semi-private reinsurance contracts structured as fully collateralized notes. Function similarly to cat bonds but are typically placed with institutional investors rather than traded publicly. |
| Industry Loss Warranty (ILW) Notes | Contract-based securities paying out when total industry-wide catastrophe losses exceed a predefined threshold. Used by reinsurers and hedge funds for macro-level hedging and diversification. |
Cat bonds offer insurers:
- Multi-year coverage at fixed costs, shielding against reinsurance price shocks.
- Regulatory capital equivalence, enabling lower rate filings.
- Diversified counterparties, reducing concentration risk in reinsurance markets.
Traditional insurance (and re-insurance) is cyclical and prone to repricing. In contrast, Cat bonds lock in terms over several years, offering financial stability even after severe weather seasons.
Cat bonds offer investors:
- Uncorrelated returns with traditional markets.
- Attractive yields relative to risk.
- Exposure to statistically rare events, independently modeled.
As climate-related losses intensify, insurers face growing capital strain. Without alternative risk-transfer tools, private markets would retreat further, leaving gaps in coverage and increasing pressure on public systems. (Jamaica’s recent windfall from Hurricane Melissa provides a contemporary example.)
What Investors Should Know
Catastrophe and resilience-based bonds redistribute climate volatility by transferring peak exposures to actors better equipped to absorb them. Such bonds invite real volatility, especially if a natural disaster hits or policy changes occur. But investors should understand that if a qualifying disaster occurs, some or all capital is lost. Furthermore, climate change, irrespective of origin, renders disasters naturally difficult to predict and model.
Despite differences in triggers or terms, all instruments reflect share a unified roadmap:
- They externalize extreme-event risk from insurers (or governments), placing it into capital markets or diversified investor pools.
- They rely on objective, rules‑based triggers or fully funded collateral, which reduces counterparty/credit risk and enhances speed and transparency of payouts.
- They distribute the financial impact of rare but severe disasters across a broader base, rather than concentrating it within traditional insurance or reinsurance entities.
- They enhance capacity and stability of the insurance sector under escalating climate and catastrophe risk or a structural reinforcement of risk‑transfer infrastructure.
 Additional Coverage
Additional coverage can be found on the author’s X page.