


China’s 2025 Soybean Pledge Echoes Past Trade Failures that Still Linger
The 2025 soybean trade framework between the United States and China has been headlined, once again, as a diplomatic milestone. At its center lies a familiar agreement: China will resume its usual, 14-year average annual import of 25 million metric tons (MMT) of U.S. soybeans for three years, with an additional 12 MMT earmarked for the current marketing year. Officials have presented it as a stabilizing commitment and an assurance to a U.S. soy complex fatigued by years of volatility.
U.S. Soybean Futures | Trading Economics
But the agreement’s history (and the present) along with the absence of enforceable terms suggest this deal could pose more as a reprise.
The performance of the 2020 Phase One agreement provides the precedent. That deal, also framed as a resolution to trade hostilities, featured high-volume purchase targets and similar ceremonial rollout. Yet China failed to meet its agricultural quotas by wide margins from the start, particularly in soybeans, where reported shortfalls were compounded by dark pool market cancelations and deferred shipments. Despite the publicity, the deficiencies of the agreement, namely the lack of purchase floors, the absence of penalties, and limited monitoring, rendered it symbolic.
Coincidentally, the recent announcement of a formal investigation into China’s years-old negligence is of a similar vintage and will likewise result in no recourse.
Promises Amid a Failing Soybean Economy
The current framework reproduces these weaknesses. Although the 25 MMT target sounds substantial, it falls short of past peak volumes and contains no binding provisions. There are no contractual safeguards against underperformance. No independent mechanism for verification. No penalty architecture. It is a political understanding disguised as an economic commitment.
Archer-Daniels Stock Price Today | NYSE: ADM Live – Investing.com
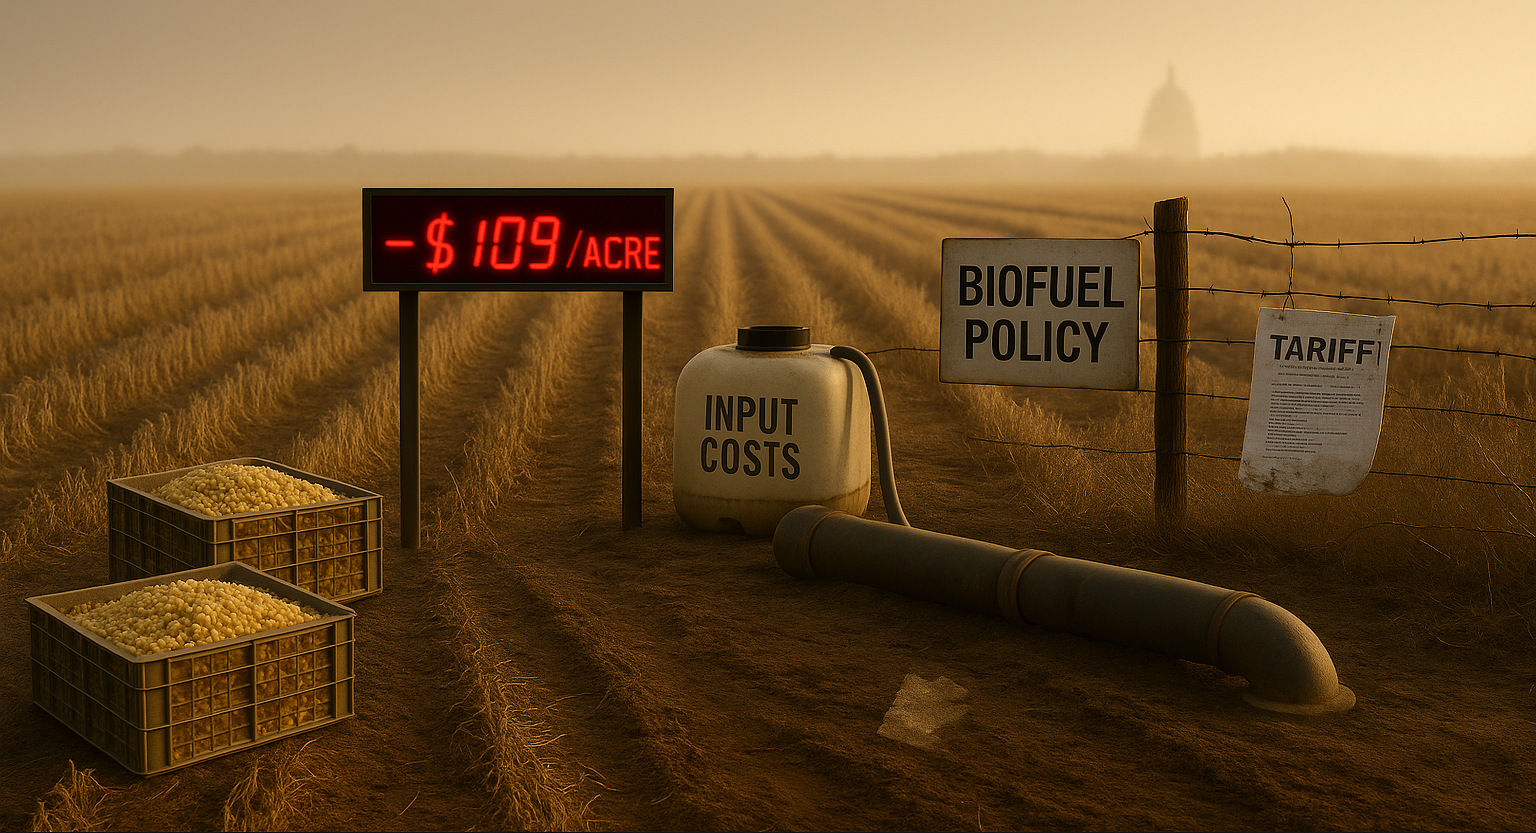
Meanwhile, domestic conditions for soybean producers have deteriorated. Crush margins remain compressed, biofuel policy remains inconsistent, and processing capacity has not expanded to match supply-side pressures. In 2025, U.S. farmers are projected to lose $109 per acre, largely due to elevated input costs, many of which remain linked to unresolved tariff structures originating from earlier trade disputes. This operating environment is structurally unsustainable, and unbinding agreements to resume business-as-usual trade volumes do nothing to alter it.
Bunge Stock Price Today | NYSE: BG Live – Investing.com
Critically, the cost of relying on symbolic trade diplomacy is compounding. Between 2018 and 2024, China officially canceled 1.53 MMT of U.S. agricultural contracts across soybeans, corn, and wheat. However, speculative modeling based on futures-basis divergence and corroborated trade press estimates places actual cancelations closer to 2.3 MMT, suggesting that at least 771,000 metric tons were withdrawn without public disclosure. The pattern is one revealing foreign trade retaliation but also domestic reporting secrecy: shipments quietly rolled forward, orders silently dropped, and delivery failures masked by spot price discrepancies.
China’s U.S. Grain Import Cancelations
Many agricultural contracts are altered or deferred before they reach USDA reporting thresholds, creating a persistent gap between official trade data and actual market behavior. This underreporting distorts both policy decisions and farm-level risk assessments. In soybean oil markets, for instance, local cash prices often signal delivery breakdowns well before official confirmation. The growing divergence between cash and futures pricing reflects this misalignment.
| Commodity | Reported Cancelations & Quarter | Speculative Ranges* (MT) | Speculative Mean* (MT) | Est. Unreported Cancelations* (MT) |
|---|---|---|---|---|
| Soybeans | 434,000 (Q2 2018) Trade War Onset |
L: 500,000 M: 650,000 H: 800,000 |
650,000 | 216,000 |
| Corn | 327,000 (MY22–23) |
L: 400,000 M: 600,000 H: 800,000 |
600,000 | 273,000 |
| Wheat | 768,000 (MY23–24) |
L: 850,000 M: 1,050,000 H: 1,250,000 |
1,050,000 | 282,000 |
| Total | 1,529,000 (2018–2024) | L: 1,750,000 M: 2,300,000 H: 2,850,000 | 2,300,000 | 771,000 |
* Methodology provided at the conclusion of the article.
What was once episodic has become structural: optimistic announcements spark market rallies, followed by partial fulfillment and quiet reversal. Confidence erodes with each cycle. And this pattern isn’t limited to soybeans. Sorghum, cotton, pork, and ethanol have all experienced the same political trajectories: high-profile agreements lacking enforcement, clarity, or resilience.
And confirmation.
Policy Gaps Strain the Soy Complex
This disconnect extends beyond diplomacy. The June 2025 announced expansion of the Renewable Volume Obligation (RVO) was intended to stimulate soybean oil demand through higher biofuel blending mandates. Futures markets surged. But just two weeks later, the cash basis at White River Nutrition in Indiana weakened sharply (from –$0.02 to –$0.05/lb., revealing that processors had little confidence the rule would be enforced. It mirrored 2024 when a flood of imported used cooking oil crushed domestic crush margins.
Op-Ed: The Vanishing U.S. Soybean Window | Todd Anderson – LinkedIn
Even if China meets its pledges, the U.S. soy complex, notably producers, will gain little if processors remain unprofitable. The U.S. EPA’s continued failure to implement credible, enforceable biofuel rules undermines the soybean deal’s extended domestic value for the soy complex.
The problem then is twofold: unreliable diplomacy abroad and weak policy follow-through at home. Trade agreements without enforcement are vanilla press releases. Biofuel mandates without execution are simply stories.
Earlier in 2025, amid a pause in tariffs, ASA President Caleb Ragland called the diplomatic opening “a very positive first step” but stressed the importance of “hammering out important details, a sentiment that remains relevant as the October framework now faces similar scrutiny.
U.S. Equities Exposure
TradersQue presently neither provides coverage of nor consults in U.S. equities with American soybean – China trade exposure, but both Archer-Daniels Midland and Bunge Global SA represent flagship corporations available on most global trading and investment platforms.
| Company (Ticker) | U.S. Soybean ↔ China Trade Exposure | Price & YTD % Performance |
|---|---|---|
| Archer-Daniels-Midland ($ADM) | Major U.S. soybean processor and exporter. Deep exposure to China-bound soymeal and oilseed trade; sensitive to shifts in Chinese import demand and U.S. policy. | ~$60.53 +19.9% YTD |
| Bunge Global SA ($BG) |
Global soy trader and processor. Operates one of the largest soy crush and export operations; publicly acknowledged China trade as a driver of volatility. | ~$94.60 +21.7% YTD |
Appendix: Methodology for Speculative Cancelations
Reported Data Sources
- USDA FAS Weekly Export Sales Reports (2018–2024)
- Official cancelation notices
- Coverage from AgWeb, FarmProgress, DTN, S&P Global, USDA press releases
Speculative Estimate Framework: Estimates are inferred using a collective of market behavior, historical patterns, and trade commentary, including:
- Historical Shortfall Analysis: Compares promised vs. delivered volumes under prior deals (e.g., Phase One 2020) and identifies recurring underperformance in China–U.S. ag trade.
- Futures–Cash Basis Divergence: A widening basis (futures – cash) signals likely delivery failures (e.g., Soybean oil basis shift from –2¢ to –5¢/lb.)
- Trade Press Corroboration: Unreported “quiet exits” or order rollovers cited by analysts/traders; often not captured in USDA data
Calculation Method
- Speculative Mean (Low + Mid + High) ÷ 3
- Estimated Unreported Cancelations (Speculative Mean – Reported Volume)
- Example – Corn (2023) 327,000 MT (reported); 600,000 MT (spec. mean); 273,000MT (est. unreported).
Disclaimer
The views and opinions expressed in this article are solely those of the author and do not necessarily reflect the official policy, position, or opinions of TradersQue, LLC or its affiliates. All information is provided for informational purposes only and should not be construed as investment, legal, or other professional advice.
About the Author
Todd Anderson is Chief Operating Officer at TradersQue. He is a GRI-certified sustainability reporting professional experienced in designing, authoring, and aligning impact disclosures across corporate sectors, industry contexts, and reporting landscapes. He holds multiple advanced certifications spanning climate disclosure, framework and standards interoperability, and stakeholder engagement. He also advises on preparing sustainability disclosures for external assurance. Carbon credits and carbon markets guidance represent additional services.
He has authored sustainability reports in reference to the Global Reporting Initiative (GRI) and U.N. Sustainable Development Goals (SDGs), with additional alignment to the EU Corporate Sustainability Reporting Directive (CSRD) through the European Sustainability Reporting Standards (ESRS), as well as the Taskforce on Nature-related and Climate-related Financial Disclosures (TNFD/TCFD). His reporting integrates Greenhouse Gas (GHG) Protocol carbon accounting (Scopes 1–3) alongside SASB, IFRS/ISSB, and ISO 14000 guidance.
Additional Coverage
Additional coverage can be found on the author’s X and LinkedIn accounts.

🌿 From Compliance to Competitive Advantage:
Your Sustainability Story Starts Here
In global business, sustainability remains no longer a sidebar — it represents the storyline. At TradersQue, we guide organizations with disclosures ranging from CSR initiatives to basic ESG metrics to sustainability strategy and leadership, registering a narrative that resonates with investors, regulators, and stakeholders.
TradersQue delivers a viable framework for impact, investment, and integrity. Our reports are not simply documents; they are proof of foresight, accountability, and long-term value.
We align your assessed sustainability and ESG goals with the Global Reporting Initiative (GRI) Standards, the world’s most widely adopted sustainability reporting framework. We then identify what matters most through materiality analysis, and translate complex data into visual, stakeholder-ready reports for any business, from start-up enterprises to legacy conglomerates.
Through every stage, your organization gains:
- Visual, presentation-ready reports tailored for internal or public audiences
- Alignment with GRI Standards and UN SDGs for global recognition
- Sector-specific insights and optional third-party assurance preparation to enhance stakeholder confidence
With TradersQue, ESG and sustainability reporting become your company’s collective growth narrative—one grounded in data, shaped by vision, and certified for tomorrow’s global standards.
Your corporate resilience deserves recognition. Let us author its legacy.